Supersonic Wind Tunnel CFD Simulation
Introduction:
This project was a Computational Fluid Dynamics (CFD) investigation into axisymmetric shock wave boundary layer interactions (SWBLI) within a supersonic flow. Conducted using ANSYS Fluent, the primary objective of the study was to analyze how oblique shock waves, generated by varying cone half-angles (10, 13.5, and 16 degrees), induce flow separation and structural variations in the boundary layer under Mach 2.5 freestream conditions. Understanding these interaction zones and subsequent flow fields - including variations in pressure, velocity, and temperature - is critical in aerospace engineering, as SWBLI phenomena heavily impact the aerodynamic performance and structural integrity of high-speed vehicles and propulsion components.

Simulation Setup:
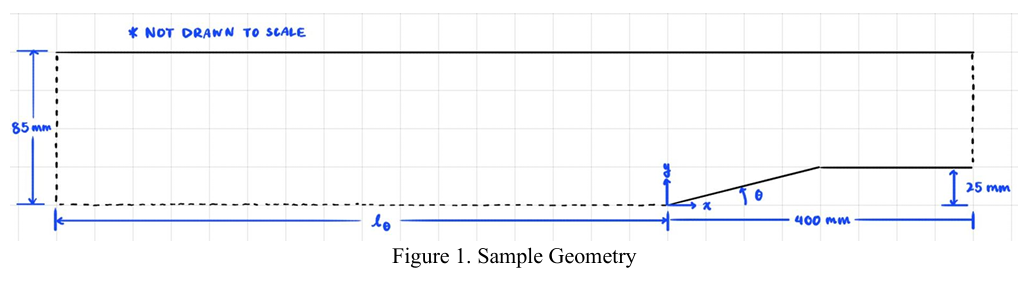
Computational Domain Geometry
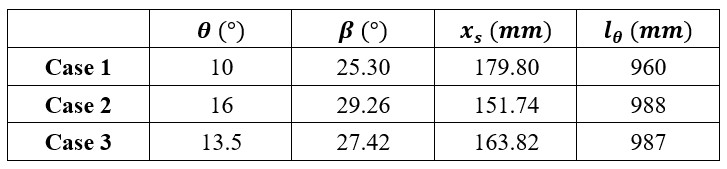
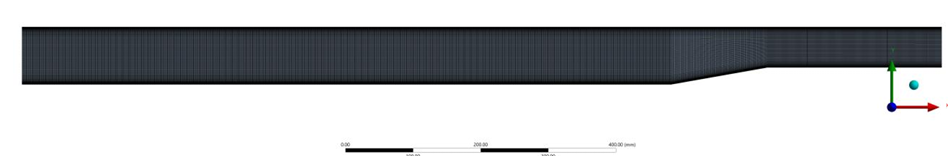
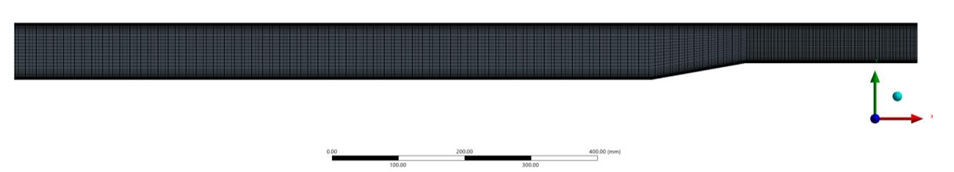
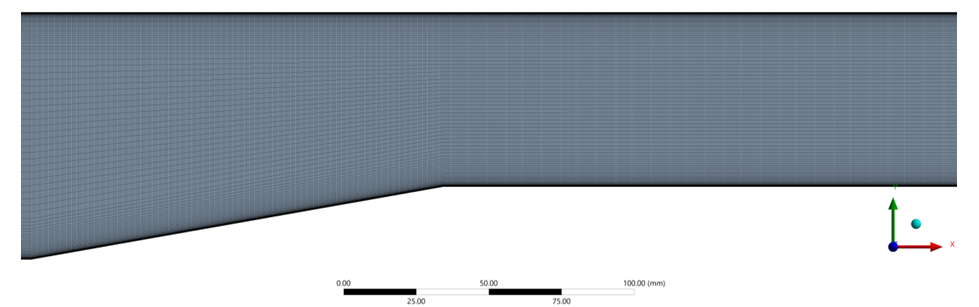
To balance accuracy and computational cost, the simulation setup simplifies a three-dimensional circular supersonic wind tunnel into an axisymmetric, two-dimensional surface of revolution spanning from the axis of symmetry to the wind tunnel wall. The test section radius is defined as 85 mm, and the shock generator cylinder radius is set to 25 mm. To accurately reproduce the physical conditions of the reference experimental data, the entry length before the cone tip had to be precisely engineered to match a boundary layer thickness of 12.84 mm upstream of the interaction region. Using conical shock relations and trigonometry based on a station located 139.7 mm upstream of inviscid shock impingement, the specific entry lengths were determined to be 960 mm for the 10-degree cone, 976 mm for the 13.5-degree cone, and 988 mm for the 16-degree cone.
Mesh Generation
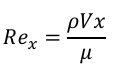
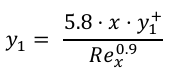
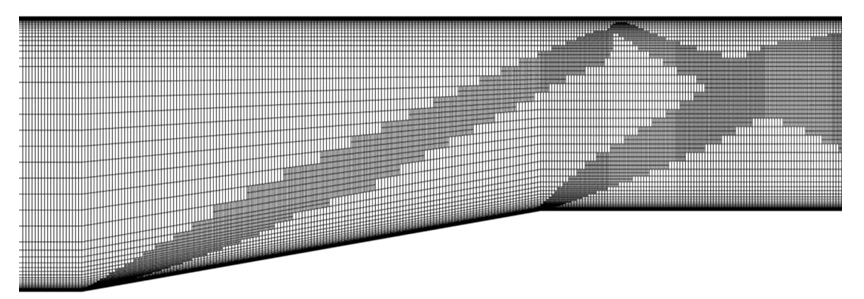
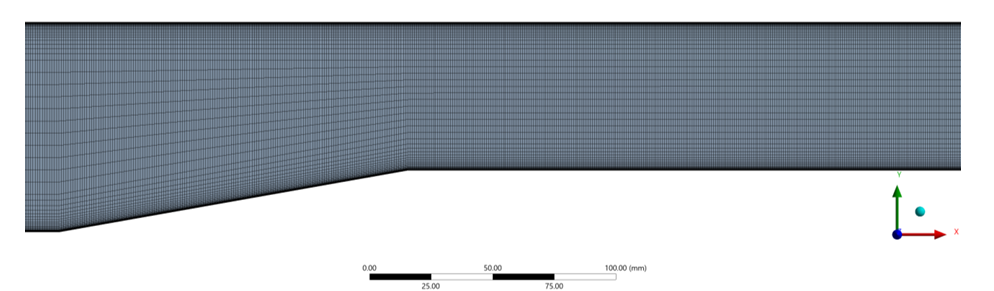
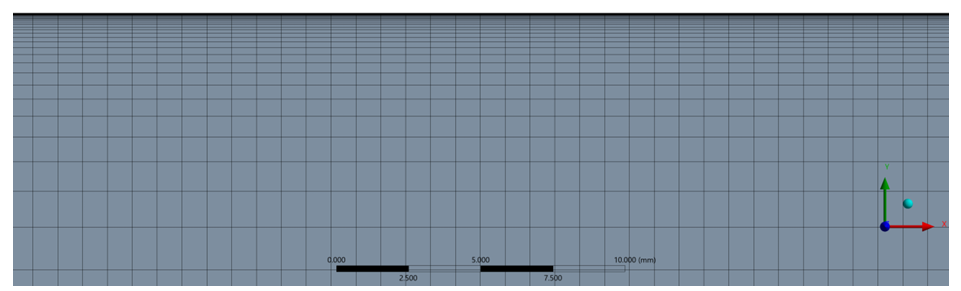
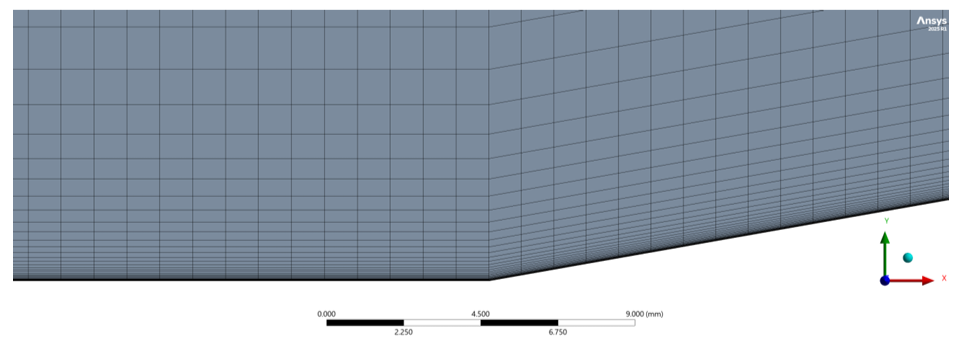
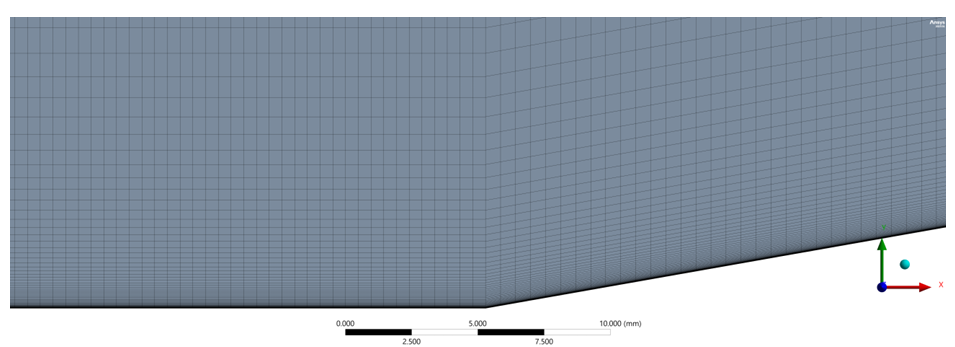
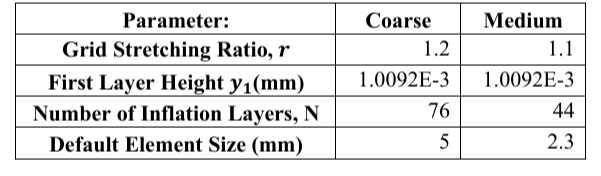
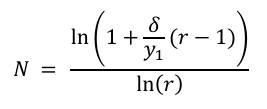
The numerical grid was designed using structured grids - specifically, a coarse mesh (approx. 150,000 elements) and a medium mesh (approx. 500,000 elements)—applying a quad-dominant Multizone method across the domain. To properly resolve the expanding boundary layer along the wind tunnel and model walls, inflation layers were integrated. The first layer height (y1) was calculated as 1.0092E-3 mm based on a local Reynolds number at x = 1000 mm and a target wall y+ value of 0.75, which kept the maximum cell aspect ratio below 1000. Grid stretching ratios (r) of 1.2 for the coarse mesh and 1.1 for the medium mesh yielded 76 and 44 inflation layers, respectively, while global default element sizes were established at 5 mm and 2.3 mm to ensure smooth transitions.
→
Coarse Grid:
Medium Grid:
Simulation Settings
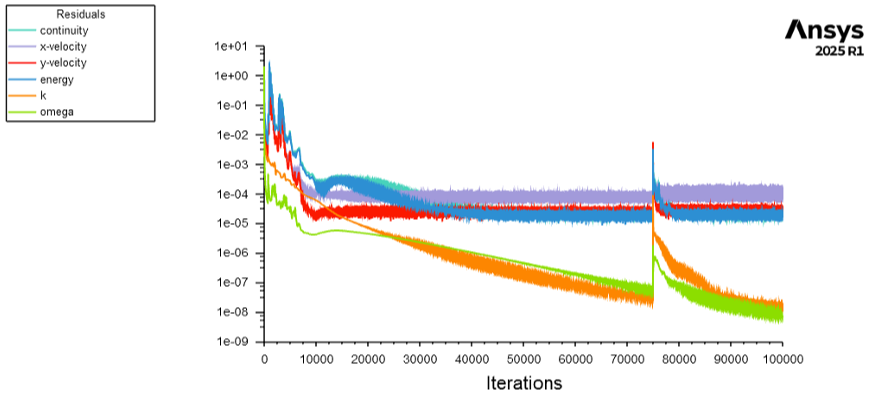
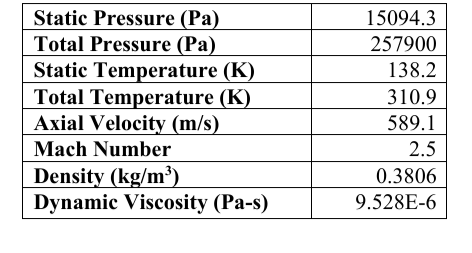
The numerical simulations solved the Reynolds-Averaged Navier-Stokes (RANS) equations utilizing a density-based implicit solver paired with Roe-FDS flux formatting. Air properties were characterized using the ideal gas law, Sutherland's law for viscosity, and the energy equation. Boundary constraints featured a pressure inlet assigned to a gauge pressure of 15,094.2 Pa and a total temperature of 310.9 K, alongside a pressure outlet set to 0 Pa gauge. Solid surfaces were modeled as stationary, adiabatic walls with no-slip conditions, and an axis boundary condition was designated along the centerline. Solutions were initially run at a Courant number of 1 until residuals stabilized; subsequently, a gradient-based adaptive mesh refinement was implemented in Fluent to double the mesh density within the shock reflection zones to achieve finalized convergence.
→
Adaptive Grid:
Results:
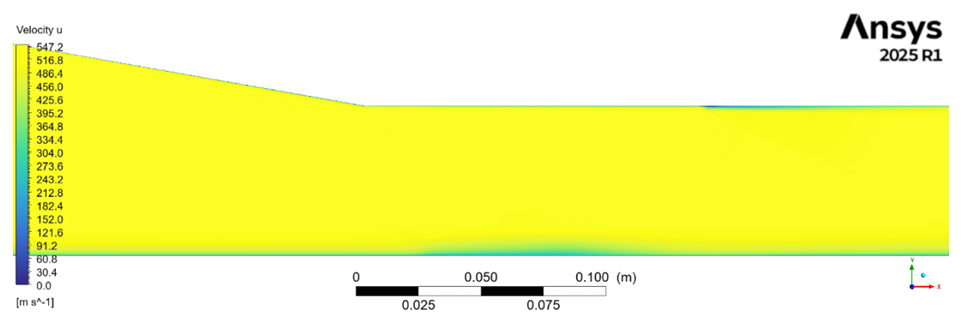
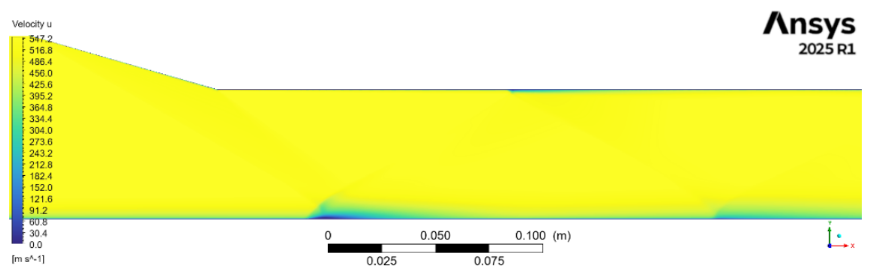
The numerical results highlight distinct behavioral changes in the shock structure and boundary layer response as the cone half-angle increases. For Case 1 (10 degrees), velocity contours show that the weak oblique shock wave is insufficient to cause flow separation. The wall shear stress dips significantly within the impingement region but remains strictly positive, demonstrating that the flow experiences a strong adverse pressure gradient but does not reverse direction. Furthermore, a comparison between grid sizes for this case reveals that the medium mesh produces sharper, more highly resolved shock reflections and a deeper shear stress trough than the coarse mesh, confirming improved flow-field capture.
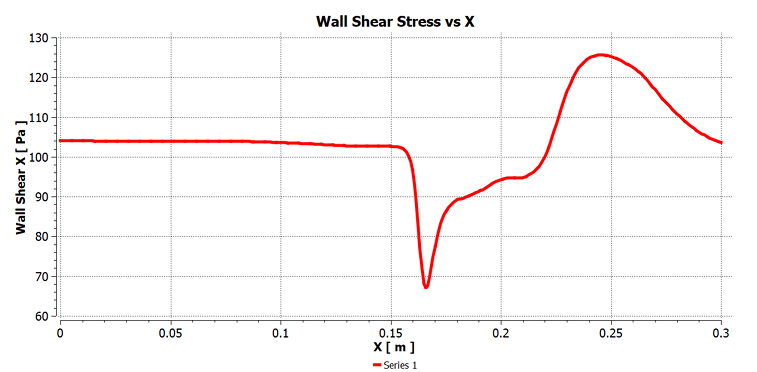
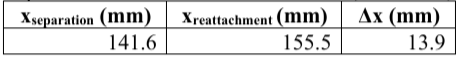
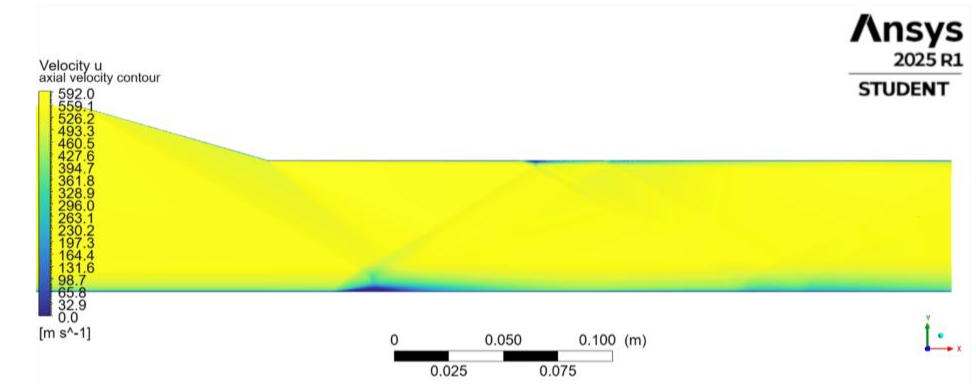
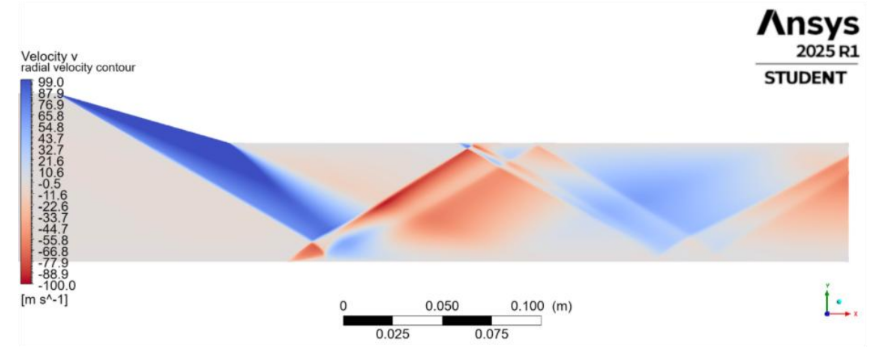
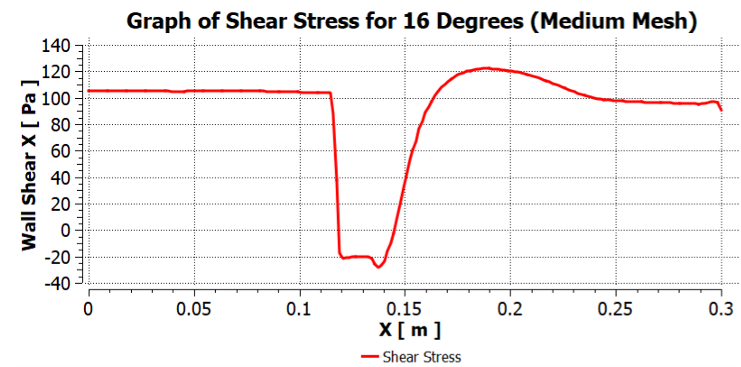
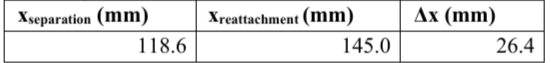
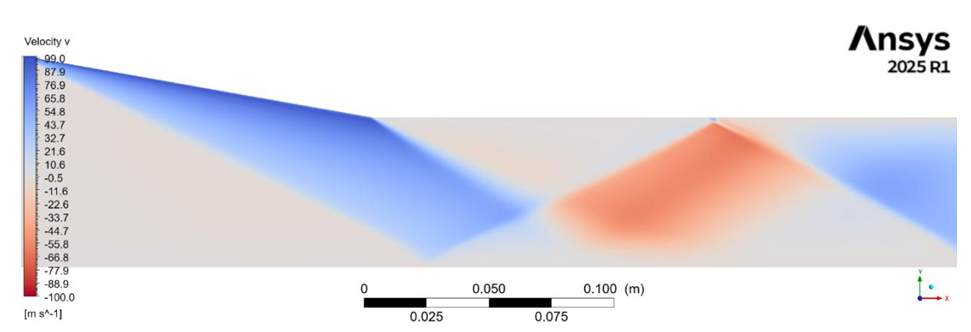
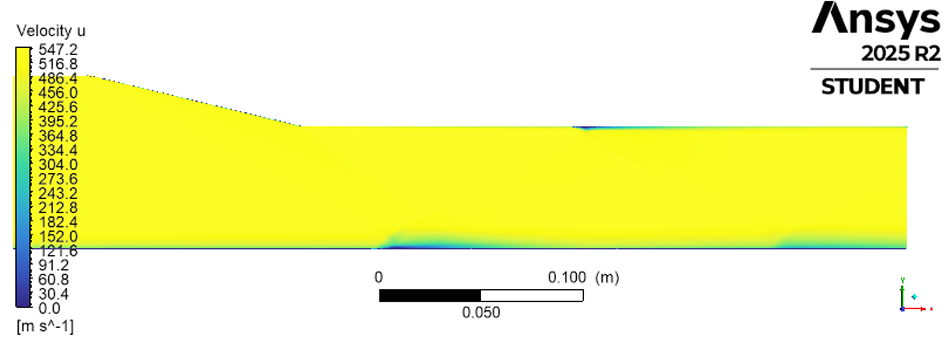
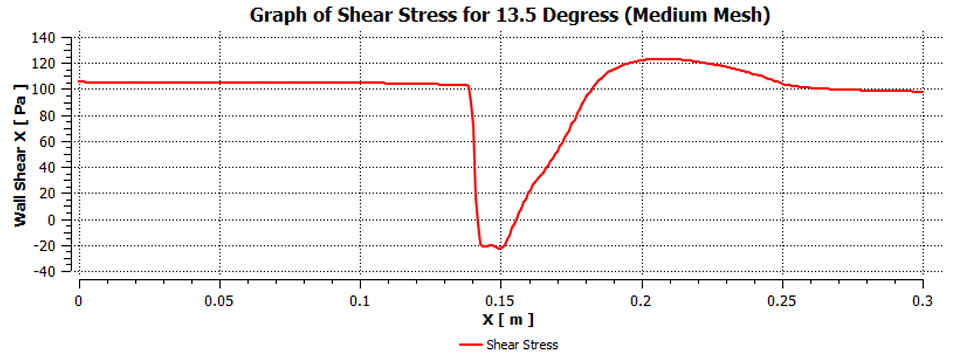
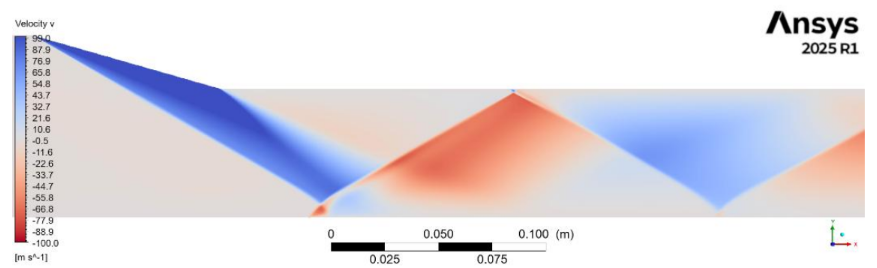
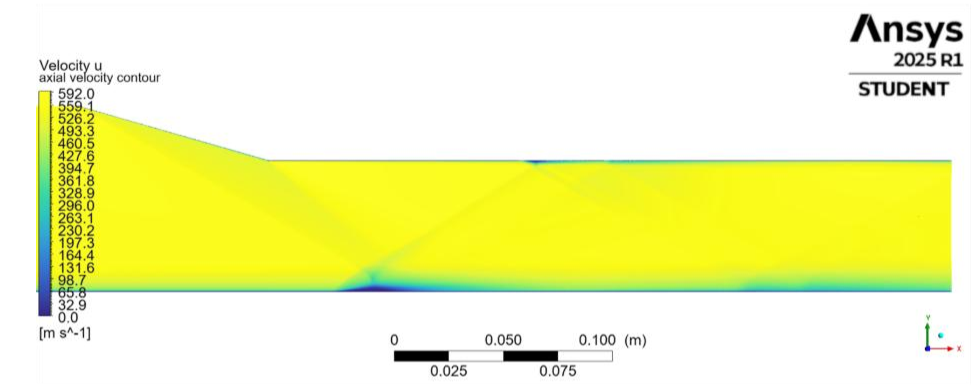
In contrast, increasing the cone angle introduces flow separation due to stronger shock interactions. For Case 3 (13.5 degrees), the stronger oblique shock causes the wall shear stress to drop below zero, indicating localized flow reversal and the formation of a separation bubble that spans a length of 13.9 mm. When the angle is extended to Case 2 (16 degrees), the resulting shock wave behaves even closer to a normal shock, forcing a massive flow detachment. The separation bubble under the standard SST k-w model expands dramatically to a length of 26.4 mm, separating at x = 118.6 mm and reattaching at x = 145.0 mm from the cone tip.
Results for 13.5 degree cone, SST-kw:
Medium Grid:
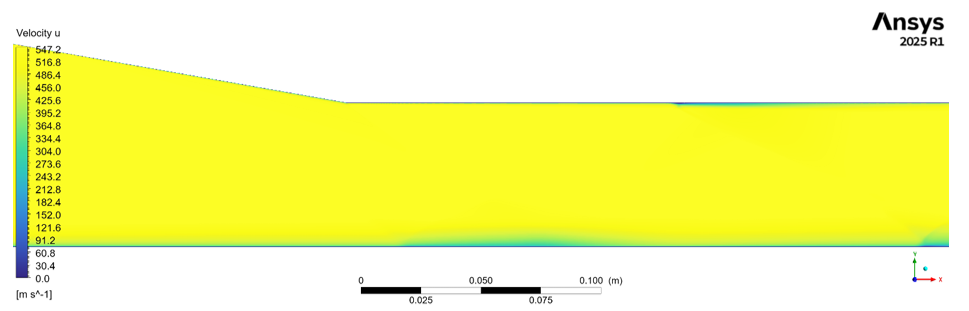
Axial Velocity Contours
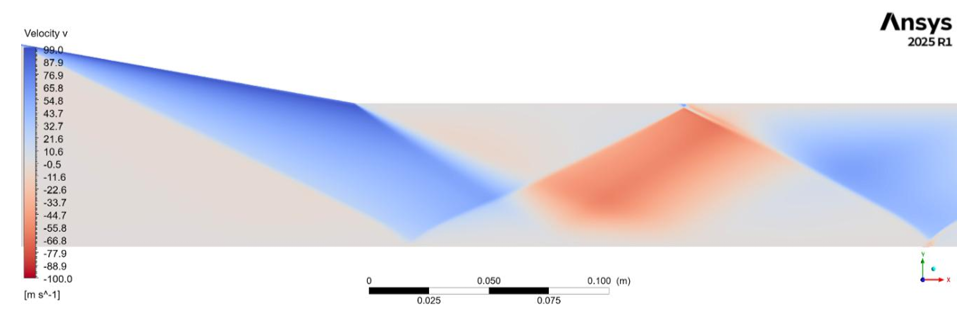
Radial Velocity Contours
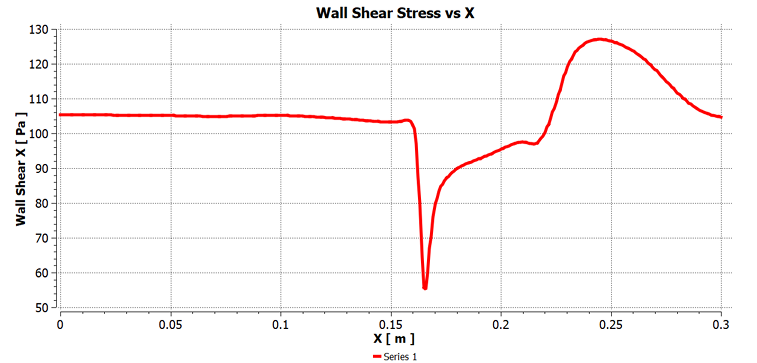
Wall Shear Stress Plots
Wall Shear Stress Plot
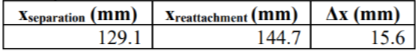
The evaluation also analyzed an extra case, mapping the 16-degree cone with the Spalart-Allmaras (SA) turbulence model to study model sensitivity. The SA model captures a noticeably smaller separation bubble (15.6 mm) compared to the SST k-w model. The SA model predicts a delayed flow separation occurring further downstream at x = 129.1 mm, though both turbulence models resolve highly similar flow reattachment points near x = 144.7 mm to 145.0 mm.
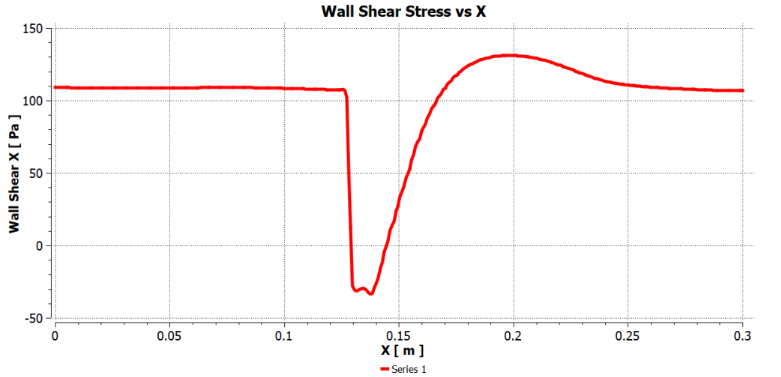
Wall Shear Stress Plot
Results for the Coarse vs Medium Grids, 10 degree cone, SST-kw:
Coarse Grid:
Axial Velocity Contour
Radial Velocity Contour
Wall Shear Stress Plot
Results for 16 degree cone, SA:

Axial Velocity Contour

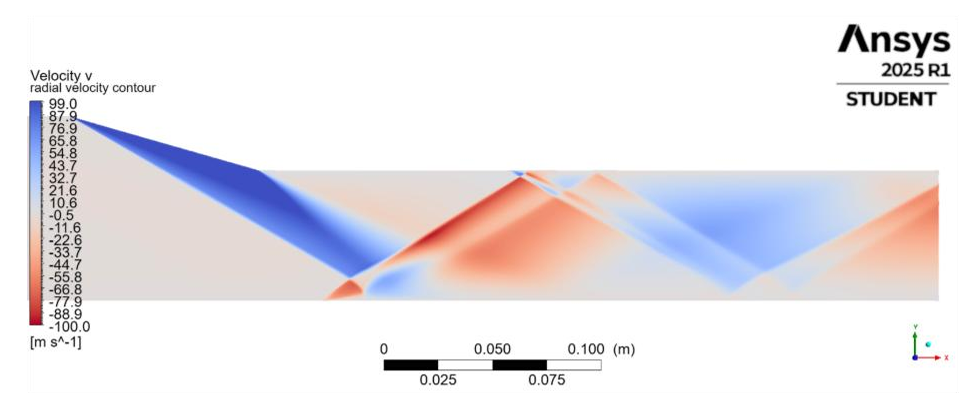
Radial Velocity Contour
Results for 16 degree cone, SST-kw:
Axial Velocity Contour
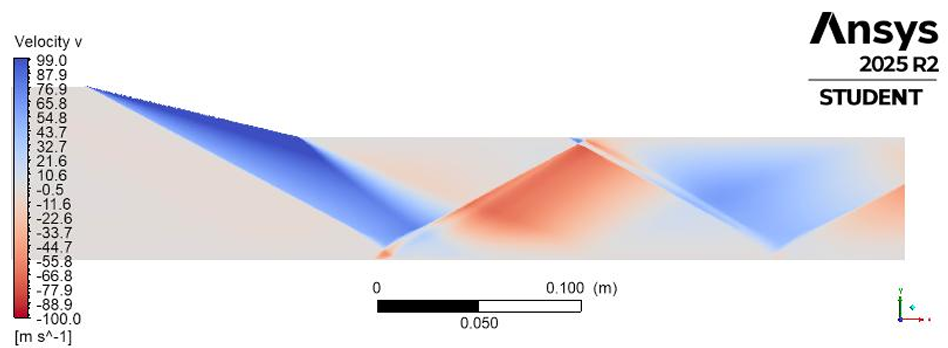
Radial Velocity Contour
Comparison to Literature:
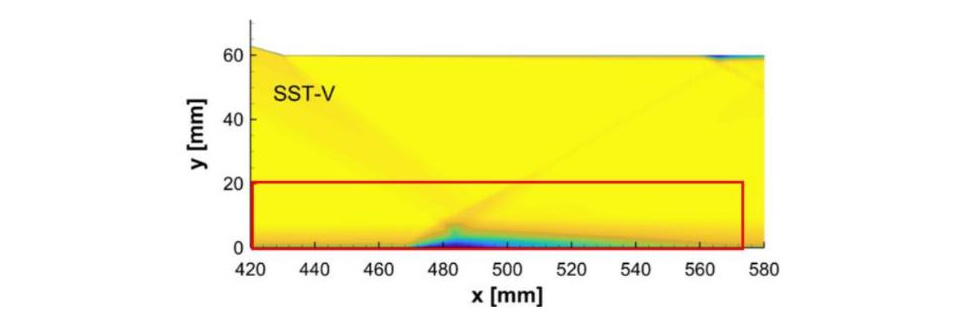
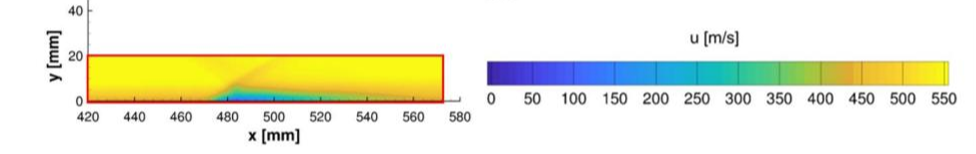
The finalized CFD solutions demonstrate strong agreement when validated against reference numerical data from Friedlander et al. (2025) and experimental Particle Image Velocimetry (PIV) data from Sasson et al. (2023). The axial and radial velocity contours for the 16 degree cone accurately replicate the exact geometry, shape, and placement of the separation bubble and the alternating pattern of subsequent reflected shocks recorded in literature. Moreover, the comparative trends established between the turbulence models—where the SST k-w model predicts an earlier separation and a larger bubble than the SA model - fully align with previous validation benchmarks. This close matching confirms that the engineered entry lengths and adaptive grid strategies successfully replicated the physical boundary layer mechanics of the experimental wind tunnel environment.
Results for 16 degree cone:
Axial Velocity Contours:
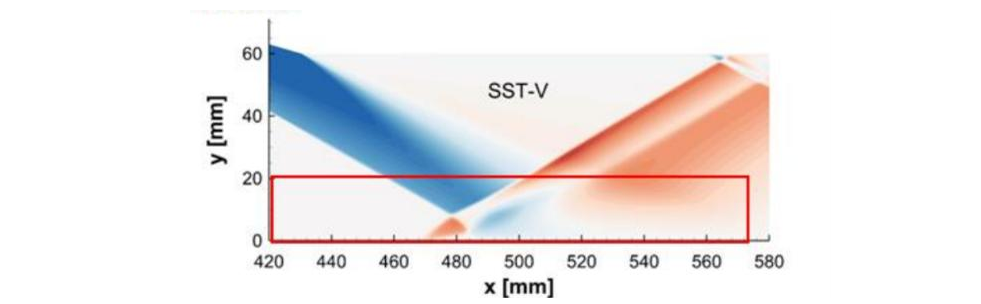
SST-V, Friedlander et al. (2025)
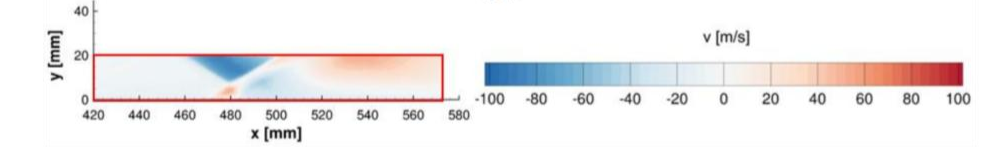
PIV, Friedlander et al. (2025)
SST k-w
SA
PIV, Friedlander et al. (2025)
SST k-w
SA
SST-V, Friedlander et al. (2025)
Radial Velocity Contours: